SS14.Watchdog detects that your server has locked up, it will kill the server and restart it. If this happens for real on a live server, a chance of just looking at logs is out of the window. This guide will give a quick 101 for how to approach debugging this kind of issue.
Just to be clear: you may get a similar error if the game server can’t reach the watchdog due to misconfiguration, in which case the game server will reliably get killed after startup, on loop. This article is not about that, this is about a genuine, real-nasty crash bug.
Background: Watchdog Pings
The watchdog expects the game server to send it regular ping messages to indicate that the game server is still alive. The game server sends these pings at a regular interval of 15 seconds (currently unconfigurable, what was past me thinking), and the watchdog expects one at least everyTimeoutSeconds in the instance configuration. If the game were to get stuck in an infinite loop of some kind, it would cease to send these pings and the watchdog would quickly kill it and restart it.
Alright, so what have we got?
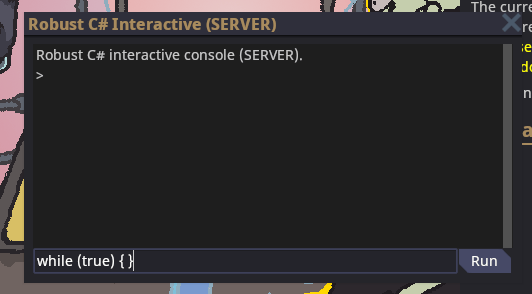
If you want to trigger this real easy, connect to your server and run something like this inscsi:
If you’re even reading this page I hope you have enough experience hosting a server to know this, but just to be clear: those two
[WARN] messages are not it.TimeoutDumpType property on the watchdog instance configuration to one of these values. Be warned that core dumps are quite big, and reporting more info can make them outright huge.
Core dumps can contain sensitive information from your server (such as database passwords) and should not be given to people you do not trust!
Using lldb
lldb is a decent2 debugger for Linux and macOS. Install it:lldb commands to do regular native debugging on native modules and whatever. Though it’s still not for the heart and may require further setup, e.g. to get symbols for native libraries.
For some meaningful info out of the managed stack trace, we can run the clrstack command from SOS:
Submission#0 which is an internal detail of the C# Interactive that we ran while (true) { } in. While I can’t show you the IL bytes or C# code in lldb (well I’m sure the former is possible with SOS), I can show you the assembly code which looks like a pretty simple infinite loop:
Using WinDBG
WinDBG is the Windows debugger you pull out when all else has failed (which it has, here). You can get WinDBG Preview from the Microsoft Store. You will also need SOS. This will extend WinDBG to make debugging a .NET trace possible: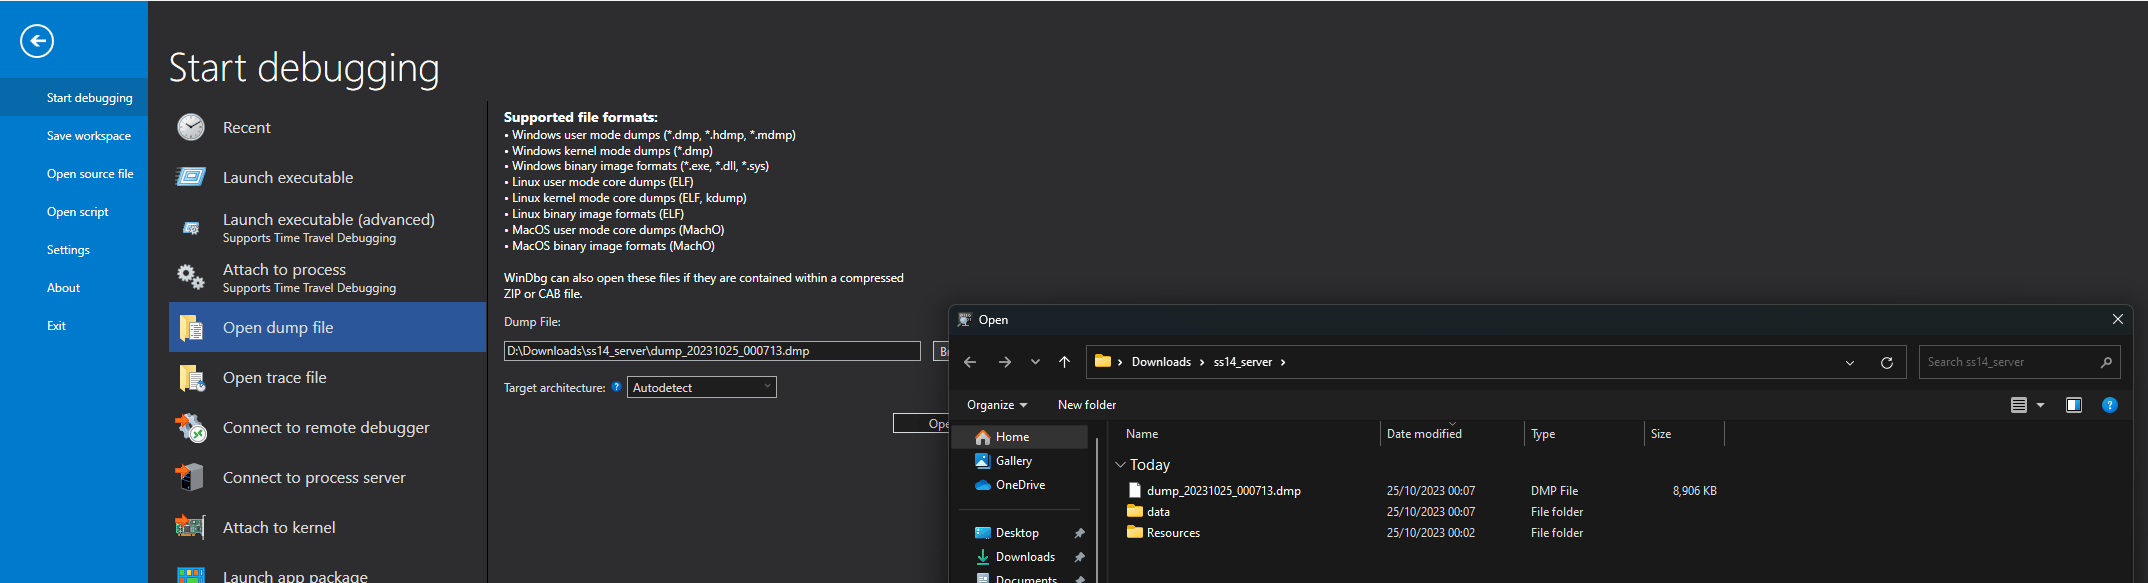
.load command mentioned in the above output to load SOS:
!clrstack to show the managed stack trace:
🤫 I actually used
dotnet dump collect to get the Windows dump because I was too lazy to set up the watchdog twice just for this article. Works the same, mostly. Hell I’m pretty sure it uses the same underlying library to create the dump as the watchdog!Footnotes
-
I tried to open a Linux core dump in WinDBG, which is supported to some degree… but it cried about enough missing files and other pains I gave up. Try moving your watchdog
bin/folder out of the way and debugging a core dump with lldb… Yeah you get wildly different results huh? ↩ - About as good as dev tooling on Linux gets, which is not very great. ↩